InfragisticsさんはXamarin.Forms向けのコントロールも提供しています。今時点だとチャート系コントロールを提供しているみたいなのでちょっと使ってみましょう。
Xamarin.Forms v2.0対応っぽいのでバージョンを2.2とかにあげてしまわないように注意が必要そうです。さて、まず、Portableのプロジェクトで以下のアセンブリを参照します。
- InfragisticsXF
- InfragisticsXF.Controls.Charts
- InfragisticsXF.Controls.Barcodes
- InfragisticsXF.Controls.Gauges
次に、Droidのプロジェクトで以下のアセンブリを追加します。
- InfragisticsAndroidBindings.dll
- InfragisticsXF.Android.dll
- InfragisticsXF.Controls.Barcodes.Android.dll
- InfragisticsXF.Controls.Charts.Android.dll
- InfragisticsXF.Controls.Gauges.Android.dll
最後にiOSプロジェクトに以下のアセンブリを追加します。
- InfragisticsXF.iOS.dll
- InfragisticsXF.Controls.Barcodes.iOS.dll
- InfragisticsXF.Controls.Charts.iOS.dll
- InfragisticsXF.Controls.Gauges.iOS.dll
- IG.Unified.dll
- IGChart.Unified.dll
追加したらあとはデータを準備してバインドするだけです。今回はとりあえずこんな感じのPersonクラスと、それを性別ごとに集計したPiChartModelクラスを準備してます。
using Prism.Mvvm;
using System;
using System.Collections.Generic;
using System.Collections.ObjectModel;
using System.Linq;
using System.Text;
using System.Threading.Tasks;

namespace App34.Models
{
    public class ChartApp
    {
        public static ChartApp Default { get; } = new ChartApp();

        public ObservableCollection<Person> People { get; }

        public IEnumerable<PiChartModel> PiChartModels =>
            this.People
                .GroupBy(x => x.Sex)
                .Select(x => new PiChartModel
                {
                    Label = x.Key == 0 ? "男" : "女",
                    Value = x.Count(),
                });

        public ChartApp()
        {
            var r = new Random();
            this.People = new ObservableCollection<Person>(Enumerable.Range(1, 100)
                .Select(x => new Person
                {
                    Name = $"tanaka{x}",
                    Age = r.Next(50),
                    Sex = r.Next(2),
                }));
        }
    }

    public class Person : BindableBase
    {
        private int age;

        public int Age
        {
            get { return this.age; }
            set { this.SetProperty(ref this.age, value); }
        }

        private string name;

        public string Name
        {
            get { return this.name; }
            set { this.SetProperty(ref this.name, value); }
        }

        private int sex;

        public int Sex
        {
            get { return this.sex; }
            set { this.SetProperty(ref this.sex, value); }
        }

    }

    public class PiChartModel : BindableBase
    {
        private string label;

        public string Label
        {
            get { return this.label; }
            set { this.SetProperty(ref this.label, value); }
        }

        private int value;

        public int Value
        {
            get { return this.value; }
            set { this.SetProperty(ref this.value, value); }
        }

    }
}
ViewModelは、手抜きで、これらのデータを右から左にするだけです。すいません。
using App34.Models;
using Prism.Mvvm;
using System;
using System.Collections.Generic;
using System.Collections.ObjectModel;
using System.Linq;
using System.Text;
using System.Threading.Tasks;

namespace App34.ViewModels
{
    public class MainPageViewModel : BindableBase
    {
        public ObservableCollection<Person> People => ChartApp.Default.People;

        public IEnumerable<PiChartModel> PiChartModels => ChartApp.Default.PiChartModels;
    }
}
あとは、Infragisticsのコントロールにバインドするだけです。
<?xml version="1.0" encoding="utf-8" ?>
<ContentPage xmlns="http://xamarin.com/schemas/2014/forms"
             xmlns:x="http://schemas.microsoft.com/winfx/2009/xaml"
             xmlns:ig="clr-namespace:Infragistics.XF.Controls;assembly=InfragisticsXF.Controls.Charts"
             xmlns:ViewModels="clr-namespace:App34.ViewModels;assembly=App34"
             x:Class="App34.Views.MainPage">
  <ContentPage.BindingContext>
    <ViewModels:MainPageViewModel />
  </ContentPage.BindingContext>
  <Grid>
    <Grid.RowDefinitions>
      <RowDefinition />
      <RowDefinition />
    </Grid.RowDefinitions>
    <ig:XFDataChart>
      <ig:XFDataChart.Axes>
        <ig:CategoryXAxis x:Name="xAxis"
                          ItemsSource="{Binding People}"
                          Label="Name"
                          LabelAngle="45"/>
        <ig:NumericYAxis  x:Name="yAxis" />
      </ig:XFDataChart.Axes>
      <ig:XFDataChart.Series>
        <ig:AreaSeries ItemsSource="{Binding People}"
                      ValueMemberPath="Age"
                      XAxis="{x:Reference xAxis}"
                      YAxis="{x:Reference yAxis}">
        </ig:AreaSeries>
      </ig:XFDataChart.Series>
    </ig:XFDataChart>
    <ig:XFPieChart Grid.Row="1"
                   ItemsSource="{Binding PiChartModels}"
                   LabelMemberPath="Label"
                   ValueMemberPath="Value"
                   VerticalOptions="Center"/>
  </Grid>
</ContentPage>
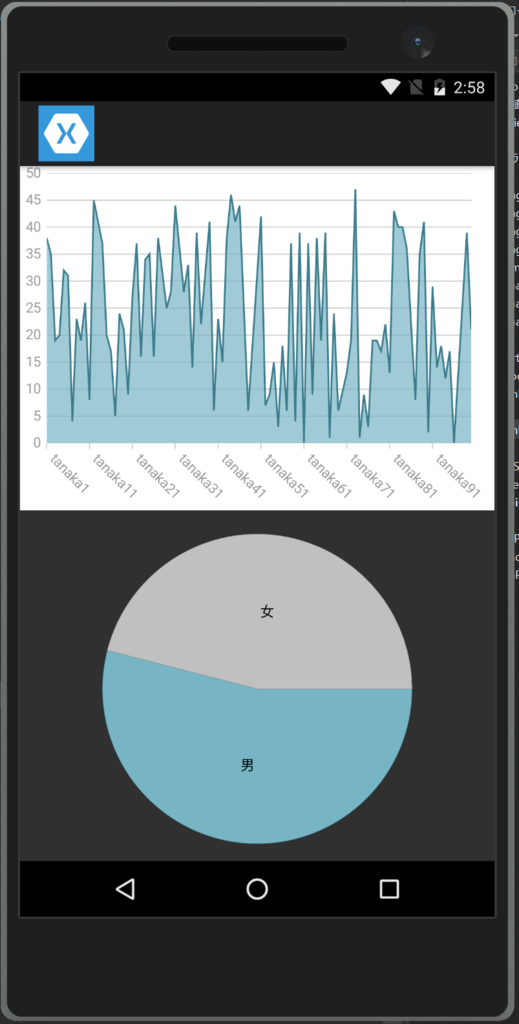
XFDataChartが今回折れ線グラフを表示していて、x軸に名前y軸に年齢を表示しています。XSPieChartが円グラフで性別の分布を表示しています。実行するとこんな感じになります。

意外と簡単にチャートが出せますね。